
KPIs have become essential for any digital product. Conversion rates, views, clicks, number of users, etc. are omnipresent in the daily lives of designers and product owners, but how to ensure that this data really contributes to decision-making? and improving the user experience?
... Thanks to the HEART method, of course! This framework will help you define metrics:
- User-centric
- Adapted to your challenges
- Useful for decision making
1 – What is the HEART method?
The HEART method was defined in 2010 by Kerry Roden, Hilary Hutchinson and Xin Fu at Google to measure UX at scale.
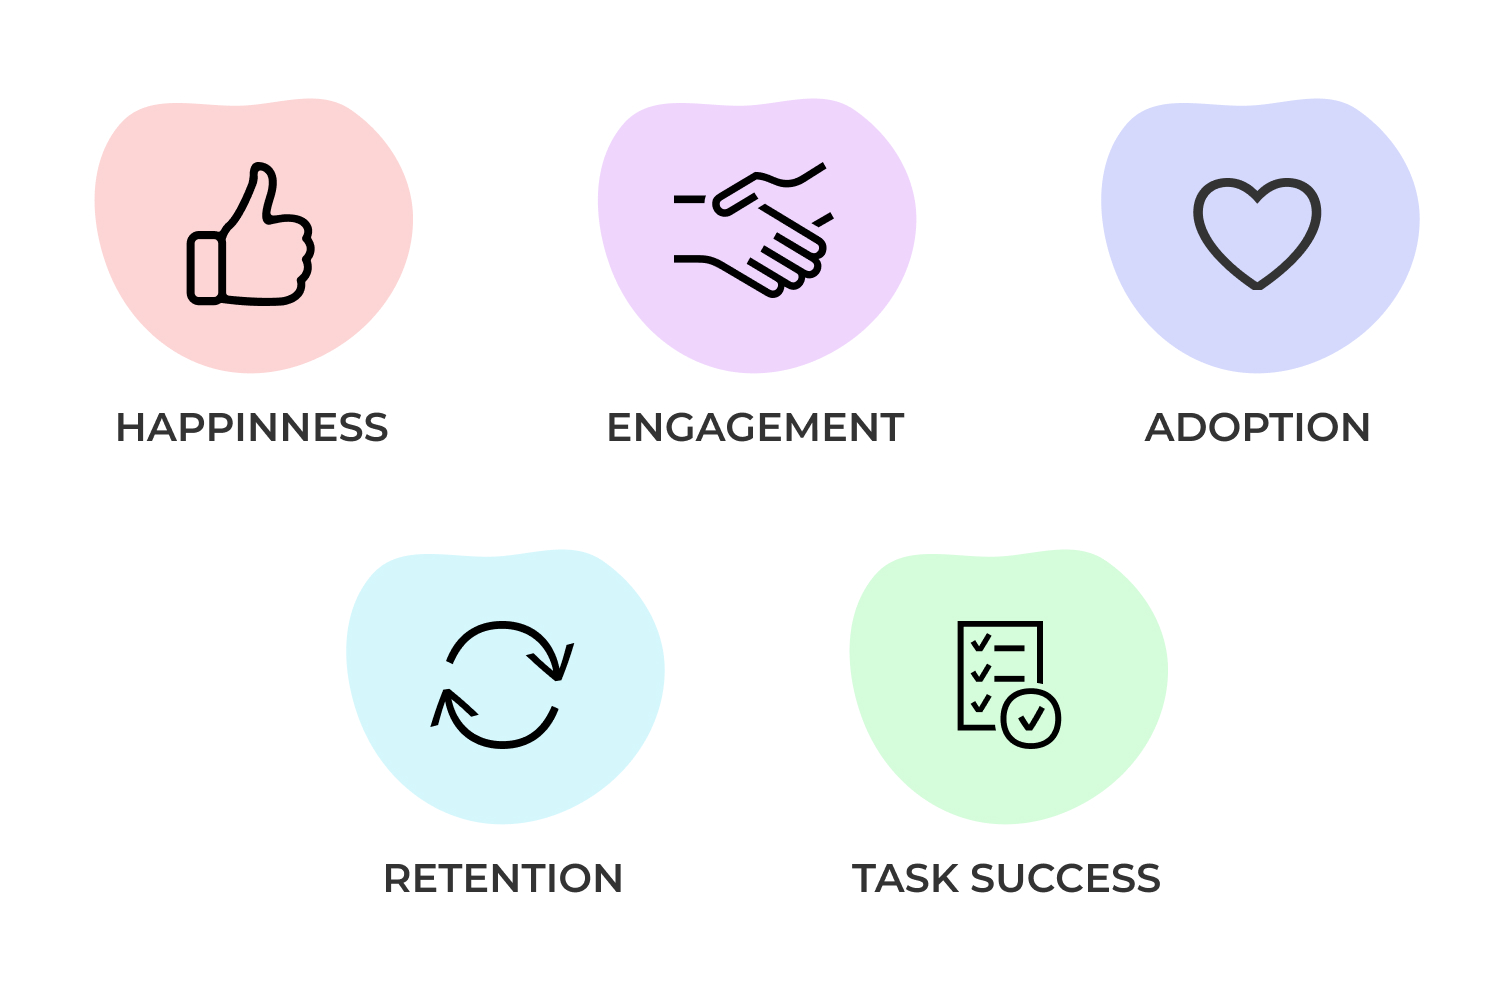
It measures the user experience on 5 main dimensions:
- Happiness
- Ecommitment
- Aoption
- Rextension
- Task success
Happiness
Are users satisfied with the product? This dimension is mainly based on attitudinal and declarative data from users. It can be measured by a satisfaction questionnaire and/or scoring (from 1 to 5 stars, NPS, etc.)
Commitment
What is the level of user involvement? What is the frequency, intensity, depth of their interaction with the product? It's up to you to set your own definition of commitment according to your challenges.
Adoption and Retention
How many new people are using the product? Can we keep them in time? Adoption and retention metrics are more relevant for a new feature or during a redesign. Be careful, however, not to misinterpret seasonal activity peaks.
Task success
Can users complete their tasks smoothly? This dimension covers the notions of effectiveness (time spent performing the task), efficiency (percentage of tasks performed), error rate, etc. It can be measured with technical KPIs such as the APPDEX combined with performance tests. large-scale usability.
2 – How to define its metrics?
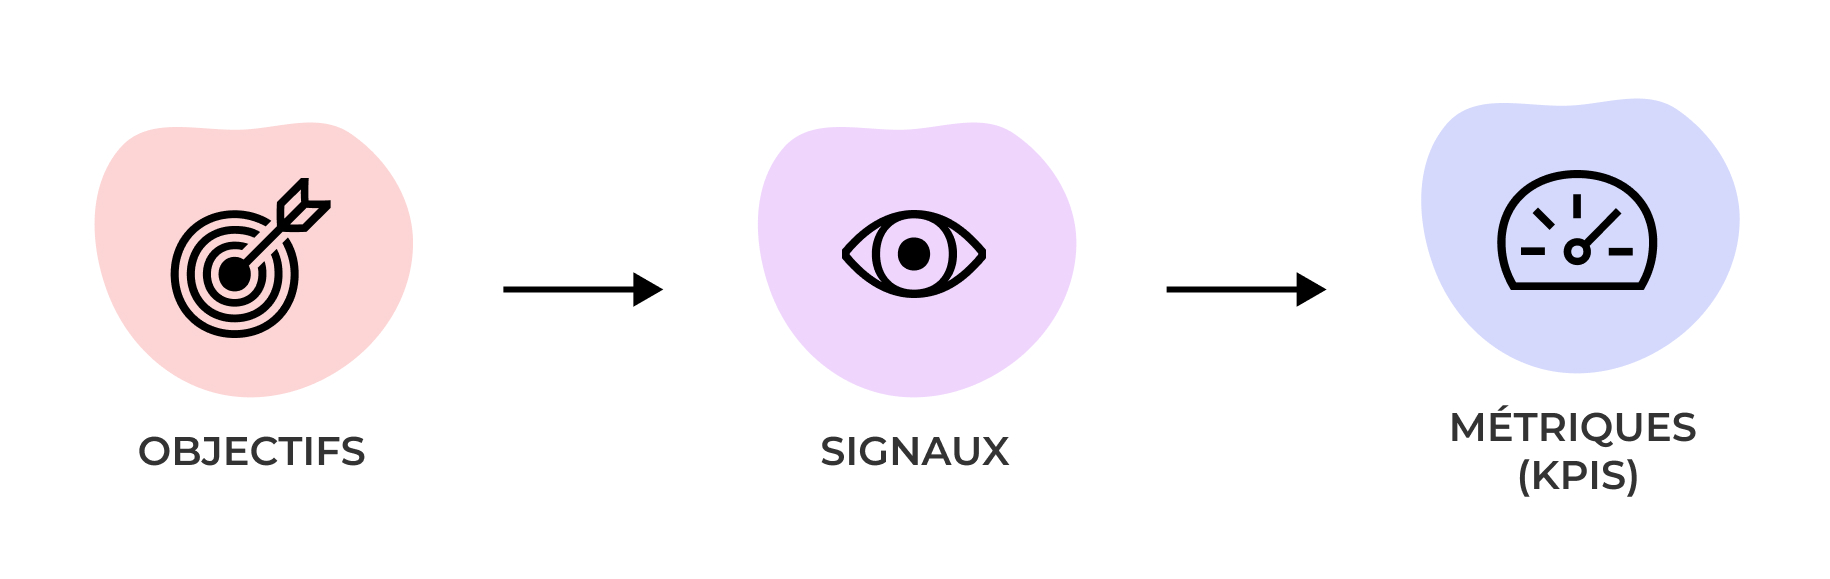
The strength of HEART is that each metric starts from a concrete objective. For each dimension, follow these 3 steps:
- list the objectives of the product
- identify the signals that prove that the objective has been achieved (or that it has not been achieved)
- define metrics (KPI) to measure the achievement of objectives
List the objectives:
For each dimension, the following questions should be asked:
- What is the goal of the product / feature?
- What is the desired user behavior?
- What is our intention behind this design/feature?
This work aligns the team around a common vision.
Ex: UX-republic wants to launch a “podcast” section with audio content on the blog. Our objectives could be the following:
| DIMENSION | OBJECTIFS |
| HAPPINESS | Users like the tone and content of the podcasts and find the player easy to use |
| ENGAGEMENT | Users frequently listen to content
and interact with us |
| ADOPTION / RETENTION | The podcast attracts new users while retaining old listeners |
| TASK SUCCESS | There is no friction when using the podcast player |
Identify the signals:
For each objective, the team must identify the signals of success or failure:
| DIMENSION | OBJECTIFS | SIGNALS |
| HAPPINESS | Users like the tone and content of the podcasts and find the player easy to use | The podcast is well rated
Users leave positive feedback |
| ENGAGEMENT | Users frequently listen to content
and interact with us |
Podcasts are listened to until the end
Listeners listen to multiple podcasts over a period of time Podcasts are more and more shared / liked / commented on |
| ADOPTION / RETENTION | The podcast attracts new users while retaining old listeners | The number of listeners increases
The number of listens per podcast increases Initial users don't leave |
| TASK SUCCESS | There is no friction when using the podcast player | Reading is fluid without delays
There are no error messages while playing |
Define metrics (KPI)
Finally, the team can define the metrics related to these signals. I advise you to favor ratios and percentages rather than raw figures, which will inevitably increase with your number of users. Also consider frequency or timing.
For example: knowing the percentage of users who have listened to at least 2 podcasts at 90% over the last 30 days will be much more useful to you than the total number of listens.
| DIMENSION | OBJECTIFS | SIGNALS | KPI |
| HAPPINESS | Users like the tone and content of the podcasts and find the player easy to use | The podcast is well rated
Users leave positive feedback |
Average rating (assigned during a satisfaction survey)
Percentage of positive reviews |
| ENGAGEMENT | Users frequently listen to content
and interact with us |
Podcasts are listened to until the end
Listeners listen to multiple podcasts over a period of time Podcasts are more and more shared / liked / commented on |
Percentage of podcasts listened to at 90%
Percentage of users with more than 2 listening sessions over the last 30 days Average number of likes/comments/shares per podcast |
| ADOPTION / RETENTION | The podcast attracts new users while retaining old listeners | The number of listeners increases
The number of listens increases Initial users don't leave |
evolution of the number of unique listeners over 6 months
evolution of the average number of listens per podcast Retention rate of existing users over 6 months |
| TASK SUCCESS | There is no friction when using the podcast player | Reading is fluid without delays
There are no error messages while playing |
Player loading time
Error rate per listening session |
3 – Some tips for implementing HEART
Define metrics as a team during a workshop
- Plan a workshop of at least 4 hours (or even a series of several workshops) to define the metrics.
- Invite a multidisciplinary team (designer, PO, scrum master, developers, QA analysts, etc.) to cross-reference points of view and align yourself.
- As a preamble, share the methodology with the participants. Feel free to submit content ahead of the workshop.
- Prepare your workshop support:
– Create a large canvas, physical or virtual, with one line per dimension (Happiness, Engagement, Adoption/Retention, Task Success). Add 3 columns for goals, signals and metrics.
– Prepare post its and markers
- As a team, complete the canvas letter by letter, starting with objectives, then signals and KPIs. Do not hesitate to link each KPI to its signal / objective.
Prioritize and iterate
- Once the metrics are defined, schedule a prioritization session to define an MVP. Your workshops will surely have generated a large number of KPIs that cannot all be implemented from the start.
- Lead a discussion with the technical team to define the best analytics tool and estimate the workload
You have been warned! : Installation may require significant effort. In this case, I advise you to cut the KPIs and treat them as user stories with points and a business value.
- Once the MVP is implemented, iterate! Follow the evolution of your KPIs in the medium and long term and adjust them according to your needs.
Conclusion
I hope this article will inspire you to define user-centric, living, and impactful KPIs! The implementation of HEART certainly requires a collective effort, but it makes it possible to give meaning to its metrics while providing concrete answers to the team and the stakeholders.
References:
https://research.google/pubs/pub36299/
Orane LEFEVRE, UX Designer @UX-Republic
Image sources: https://undraw.co/illustrations
Our next trainings


UX/UI ECO-DESIGN # Paris
SMILE Paris
163 quay of Doctor Dervaux 92600 Asnières-sur-Seine

DESIGN THINKING: CREATING INNOVATION # Belgium
UX-REPUBLIC Belgium
12 avenue de Broqueville - 1150 Woluwe-Saint-Pierre


MANAGING AND MEASURING UX # Paris
SMILE Paris
163 quay of Doctor Dervaux 92600 Asnières-sur-Seine

DESIGN SPRINT: INITIATION & FACILITATION # Paris
SMILE Paris
163 quay of Doctor Dervaux 92600 Asnières-sur-Seine
UX-DESIGN: THE FUNDAMENTALS # Belgium
UX-REPUBLIC Belgium
12 avenue de Broqueville - 1150 Woluwe-Saint-Pierre


GOOGLE ANALYTICS 4 #Paris
SMILE Paris
163 quay of Doctor Dervaux 92600 Asnières-sur-Seine

ACCESSIBLE UX/UI DESIGN # Belgium
UX-REPUBLIC Belgium
12 avenue de Broqueville - 1150 Woluwe-Saint-Pierre

EXPERIENCE MAPPING # Paris
SMILE Paris
163 quay of Doctor Dervaux 92600 Asnières-sur-Seine
