More and more companies are expressing their appetite for dashboards, without sometimes even having an exhaustive list of data to display. In a data-driven economic world, what should we consult beyond turnover, in the short, medium and long term? What should we do to avoid having a dashboard full of clever figures that struggle to find their place?
Through this article, I will talk to you about data essential to a company or SaaS allowing them to manage their performance, while strengthening team cohesion and providing value to users.
 source: Freepik
1- What is a North Star Metric?
 source: Unsplash
The North Star Metric is the main (indefinite) KPI that guides you amidst the whole cloud of other KPIs that seek to deviate you from the right path. It should help put you back on the right path wherever you are, even if you are lost. In the same logic, the polar star (north star in English) :
- is still visible.
- is fixed in the sky.
- indicates north.
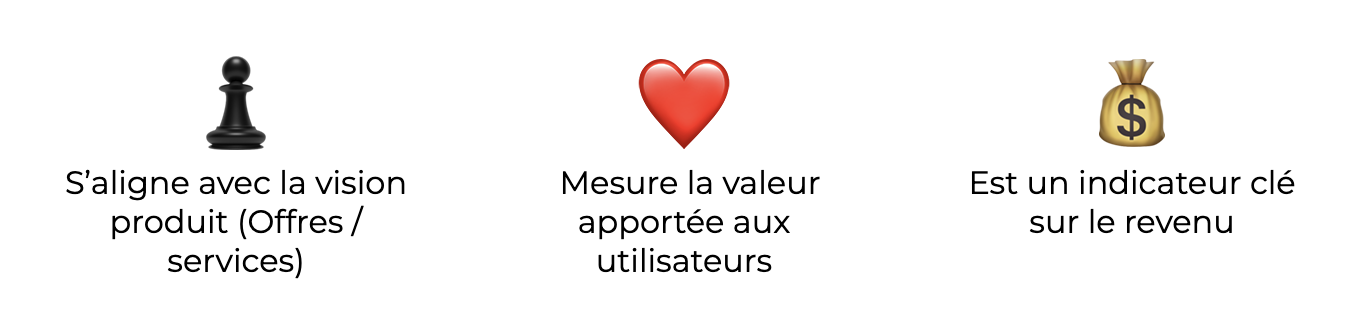
This metric must reflect both the value for users, but also for the company. She gives a common goal of the teams, a meaning to their work. From there, their only goal should be to improve this metric.
What happens if the team has not defined a clear objective in advance where it wants to work?
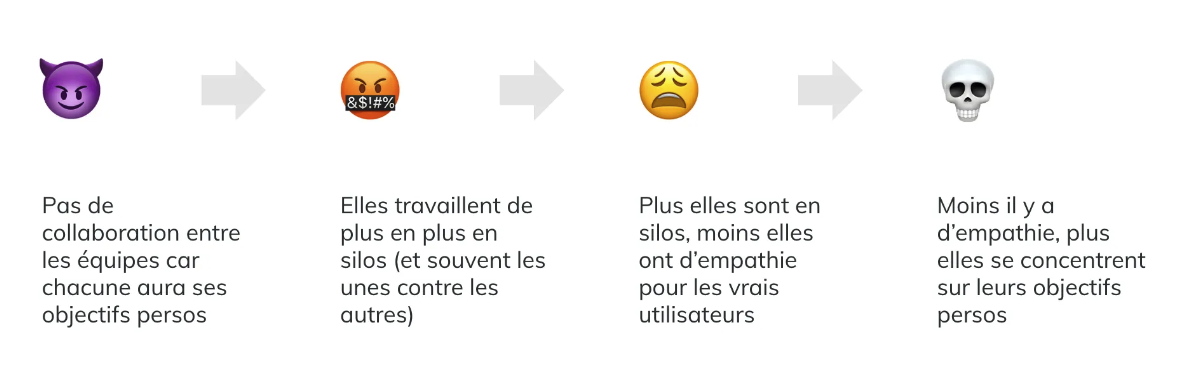
A. Lack of team synergy
Above all, a metric allows you to measure performance. As the North Star is a metric common to all employees, the non-definition of this could be the cause of 2 consequences:
 source: Gregoire Bois
B. Data Brain Freeze
 source: Freepik
Have you ever encountered overloaded dashboards that users even end up avoiding? The data collected must above all be useful and actionable. But in a world where we are afraid of missing out on something, we find ourselves drowning in a multitude of collected data without really knowing what to get from it.
Concretely, what does the North Star Metric measure?
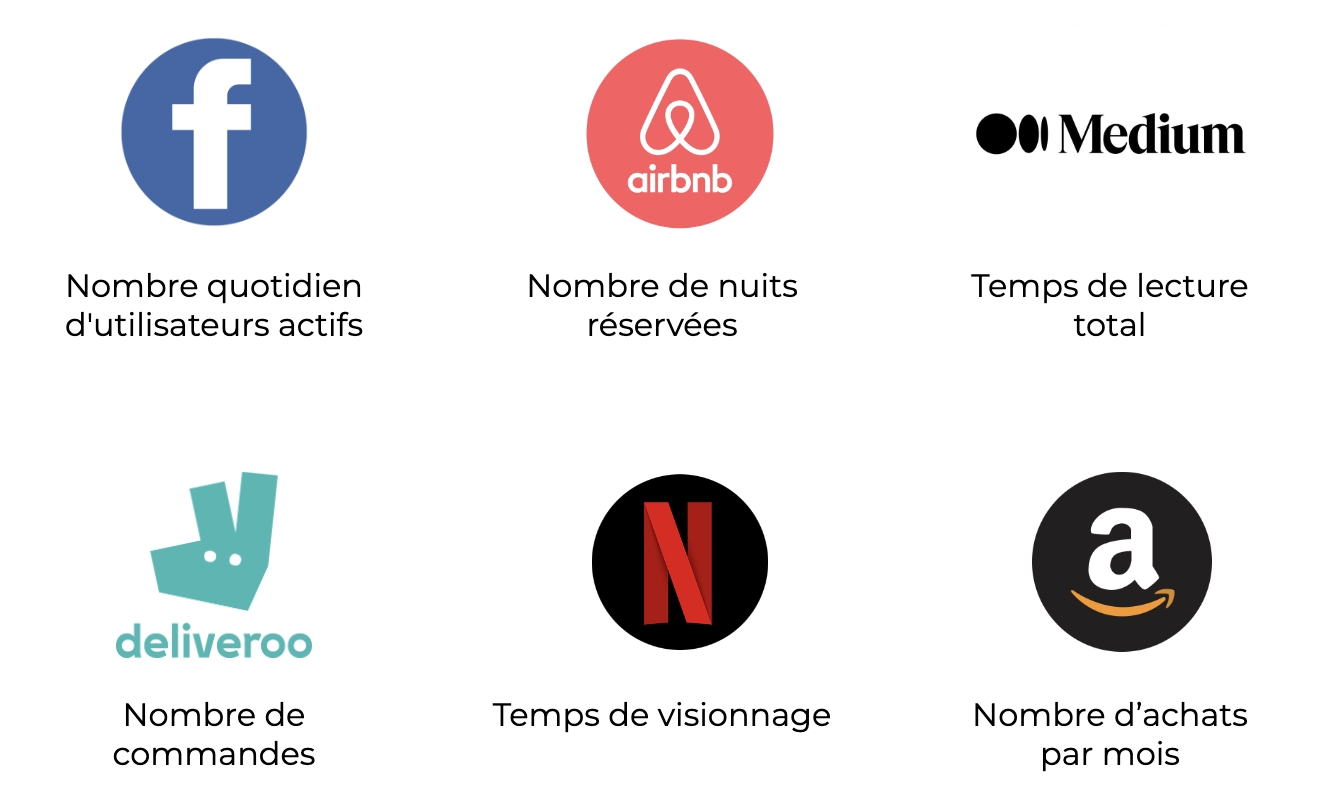
What does this simple metric, understood by all, actionable, which measures the performance of the company while providing value to employees and users “look like”? Here are some examples of North Star Metric (NSM) from well-known companies:
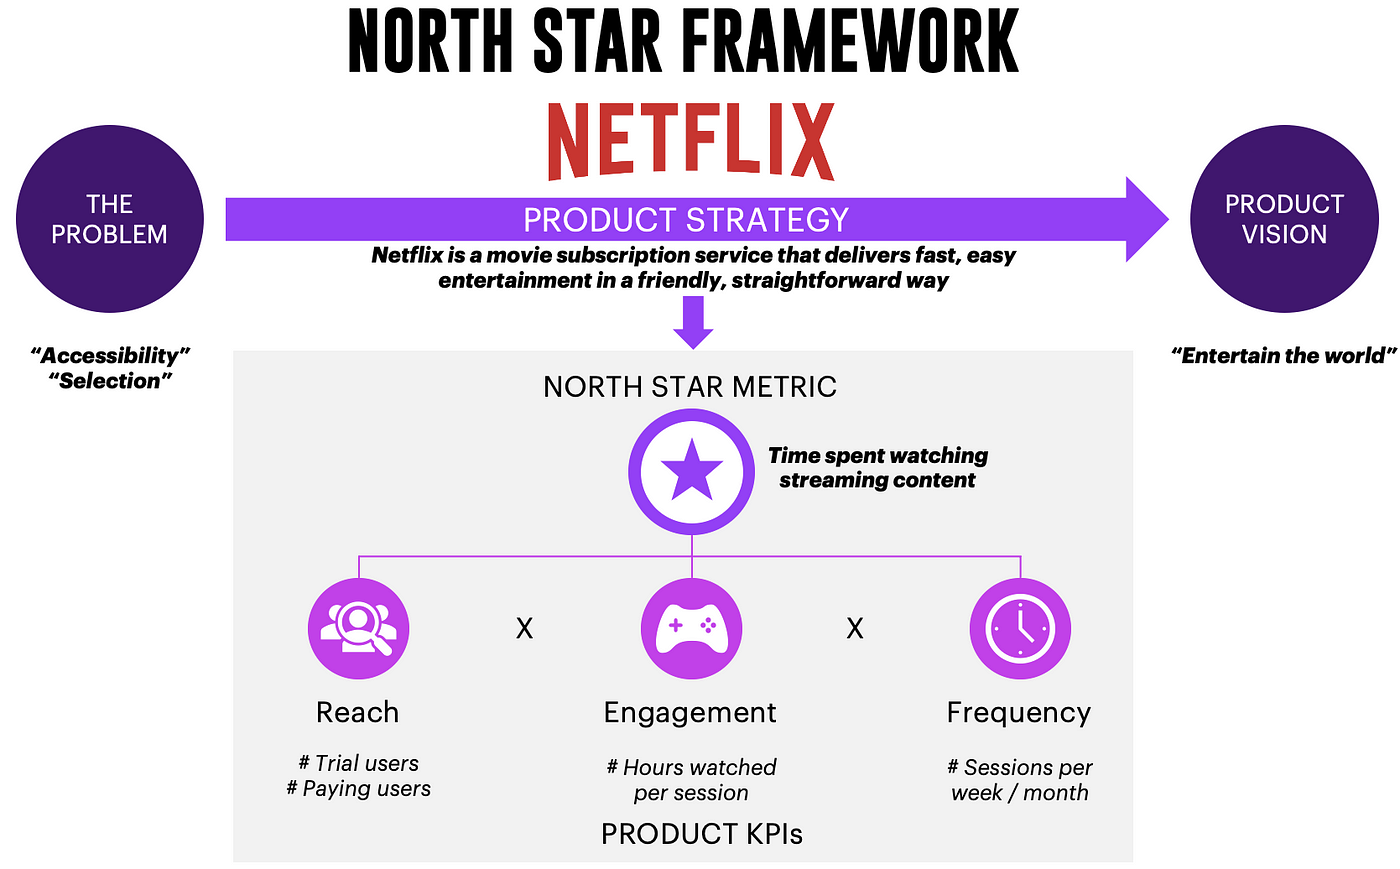
Take the example of Netflix and its North Star Metric framework:
 source: Medium
The NSM is divided into 3 sub-metrics, also called Input Metrics :
- Le number of subscribers
- THEuser engagement (viewing time per session)
- La frequency of use (number of sessions per week/month)
The “good health” of the NSM would therefore be ensured by Netflix’s business strategy.
Fun fact: In 1997, Netflix was created as an online DVD rental and purchase service delivered to your home. However, the NSM remains the same today: viewing time
In short, the North Star Metric…
2 – The NSM – OKR – KPI pyramid
⚠️ Spoiler alert: all the essential data to collect for a dashboard.
For those who wish to deepen their knowledge with OKRs and KPIs, I invite you to consult the breadth of literature on the subject.
 source: Tribes
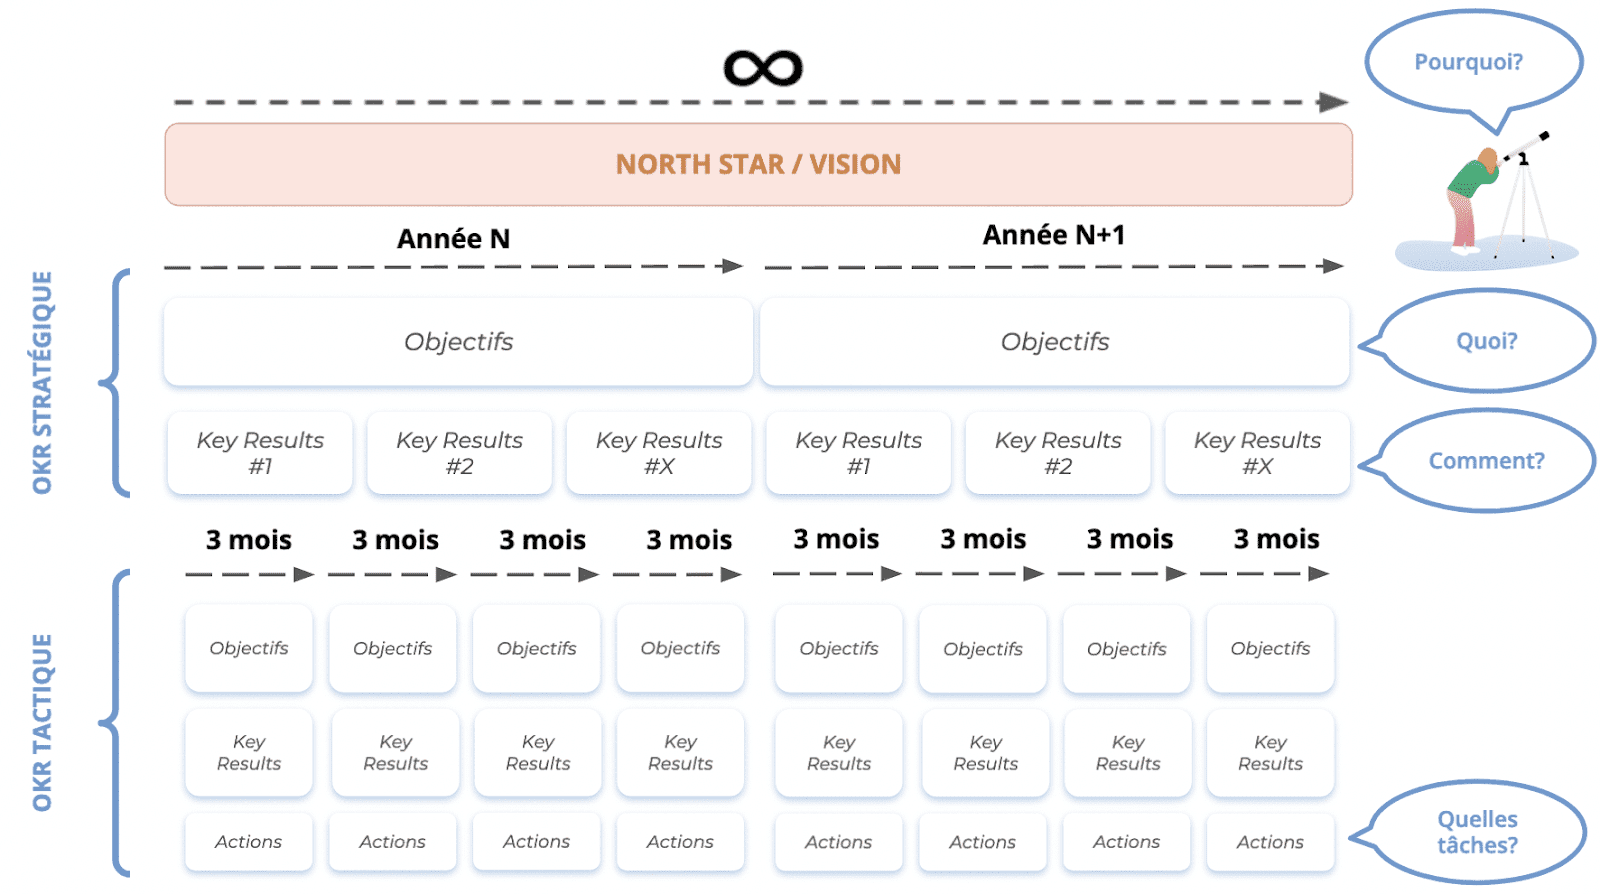
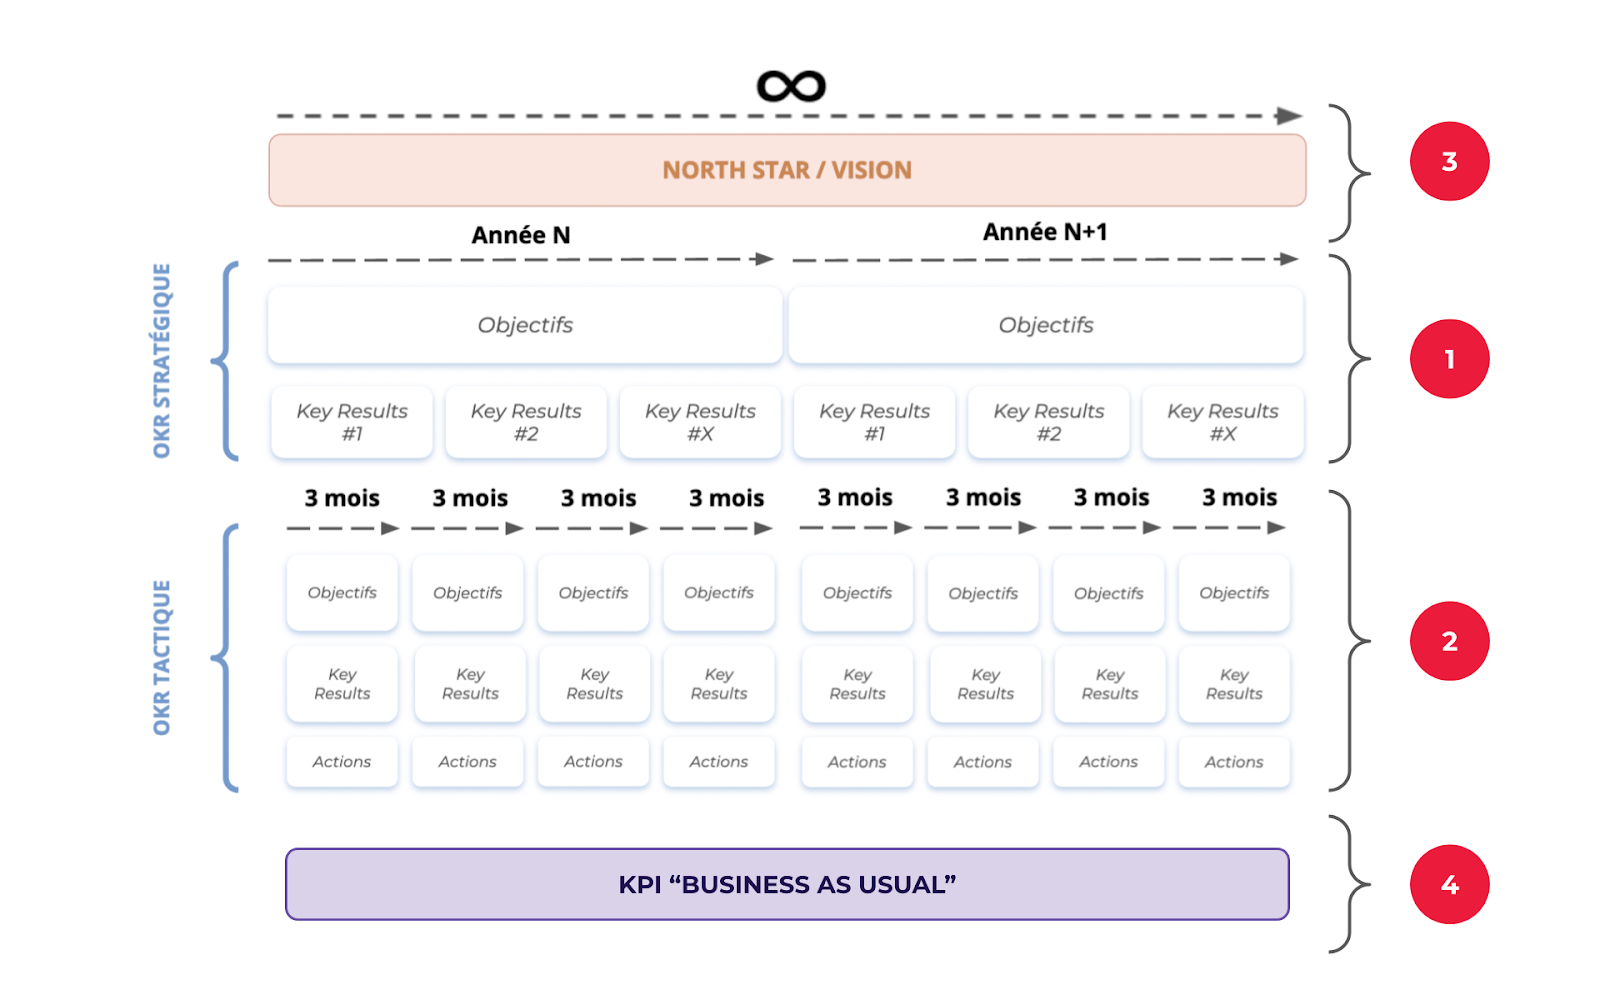
On this pyramid, we can see a distribution of actionable data in different temporalities:
- Infinitely: The North Star Metric, closely linked to the product vision, is defined over the very long term, even until the end of the product's life.
- In the long term (in years), Strategic OKRs :
- Ostrategic objectives: (ambitious!) expectations regarding the teams
- KR Strategic: Metrics that measure the achievement of these strategic objectives
- In the medium term (in months), the OKR Tactics :
- Otactical objectives: Objectives defined by the teams in relation to expectations
- KR tactics: “Measurable” tasks to verify the achievement of tactical objectives
Strategic OKRs are generally defined by the management team and tactical OKRs defined by the operational teams.
Take away: each “layer” is influenced by those of the lower level. The NSM would therefore be influenced by the strategy which would itself be influenced by the operational.
And the KPIs in all this?
Defined for an indefinite period like the North Star Metric, “Business as usual” KPIs are key metrics for measuring the functional needs of the business/product without being directly actionable, such as turnover, average basket, customer satisfaction, etc. However, certain strategic KRs can also be “Business as usual” KPIs.
Use case of this NSM – OKR – KPI pyramid
 Illustration input-output – Source: Freepik
To illustrate this pyramid, let's take a simple product example. Imagine that you are… the ministry of health whose product vision is that “All French people be in good health” ! This is measured by the NSM: Number of doctor appointments per year.
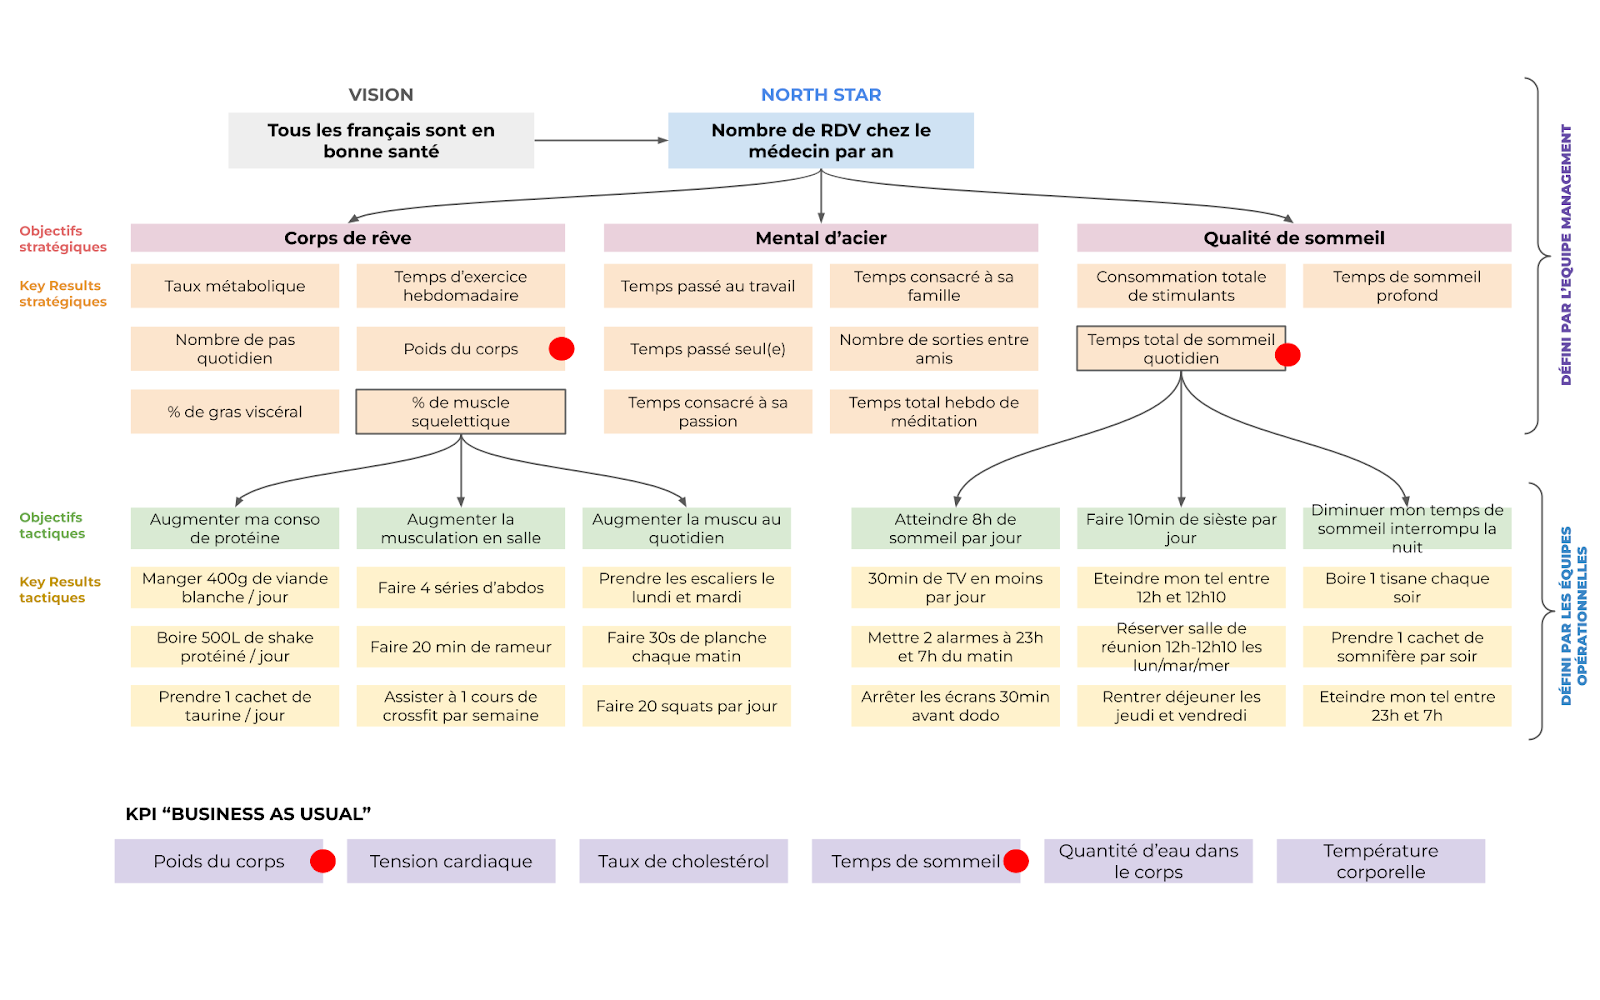
To ensure that the number of medical appointments remains below an acceptable level, 3 (ambitious!) strategic objectives must be met: having a dream body, a mind of steel and good quality sleep.
Each strategic objective is verified by a defined number of Strat KRs which are each actionable by the tactical objectives, verified by tactical KRs. For example, to achieve a certain percentage of skeletal muscle in the long term, you could choose in the medium term to increase your protein consumption and increase your weight training in the gym. It will be up to you to define the daily tactics to achieve this.
“Business as usual” KPIs are in reality what the doctor will measure during a consultation to ensure good health, whatever the strategies put in place. The red dots are the KR Strat which are also “BAU” KPIs.
3 – NSM – OKR – KPI workshop method
The NSM framework
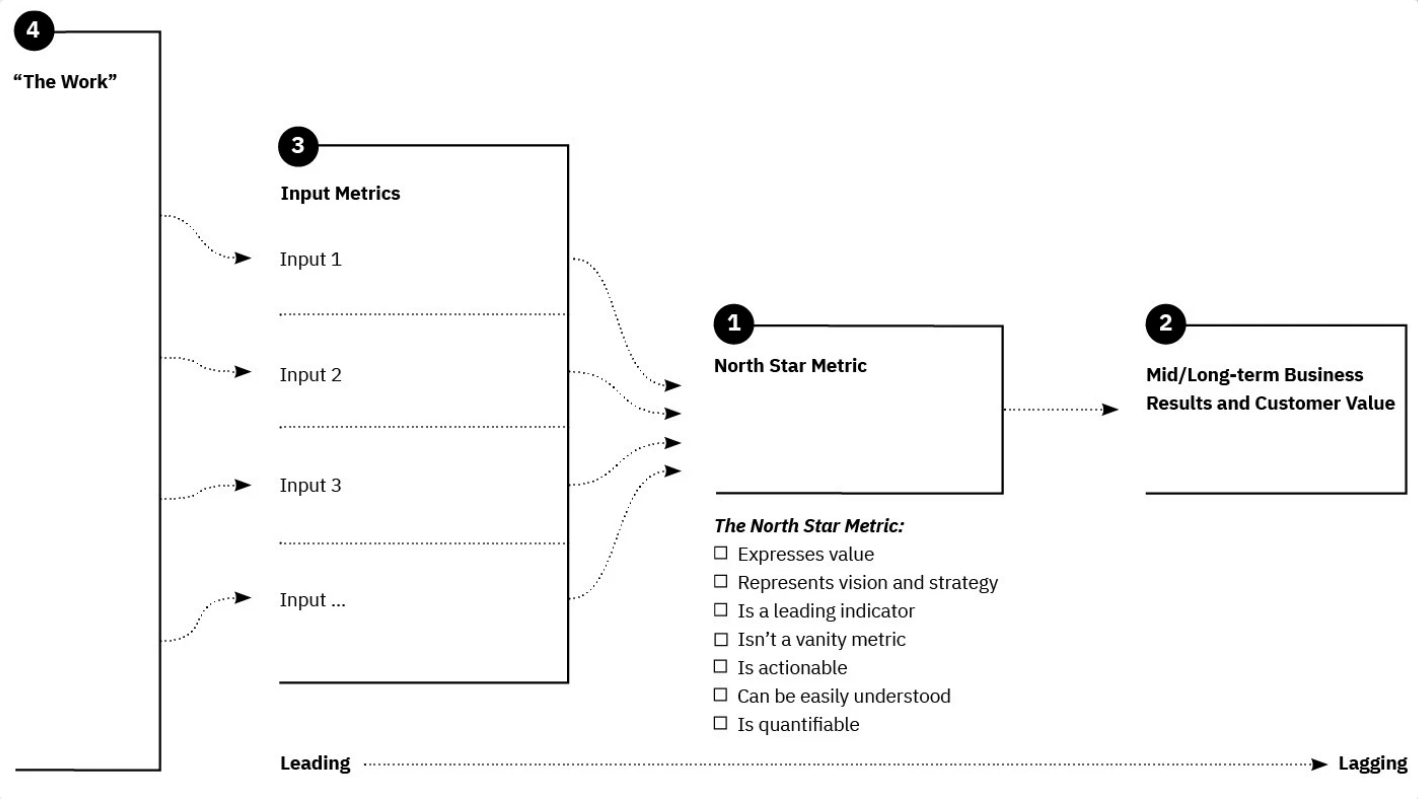
Let's take a closer look at the framework (to be obtained in the workshop) proposed by Amplitude:
source: Amplitude
4) The work : it designates the mission of the teams.
3) Input Metrics : Metrics allow you to measure the success of the product.
1) North Star Metric :
– is quantifiable.
– translates the business vision and strategy.
– is an indicator (KPI) that points in the right direction.
– is actionable.
– is easily understandable by all teams.
2) Mid/long term Business Results and customer value: these are the impacts on the business in the medium/long term.
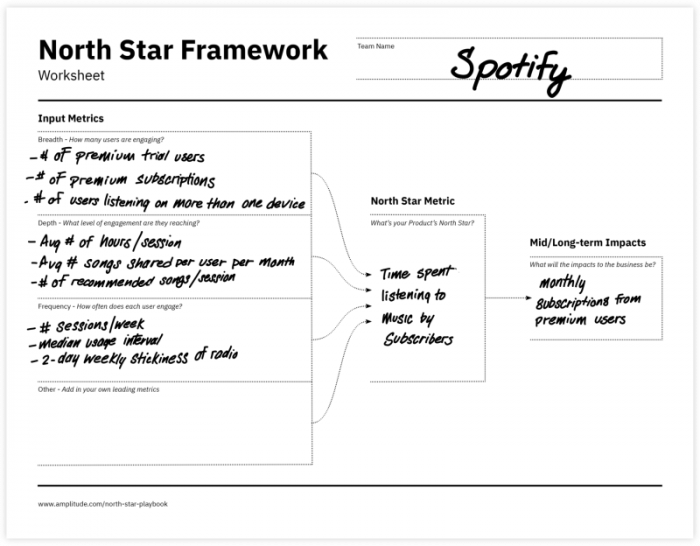
Here is how this framework is fulfilled by Spotify:
 source: Amplitude
The workshop strategy
Let's take a look at the pyramid we saw previously:
To succeed in your data workshop, I suggest you organize it by following these steps:
1 – Start with the management team to define strategic OKRs (that they know).
2 - Then, organize another workshop with operational teams for define tactical OKRs according to the strategic KRs defined upstream.
3 – Go back up the pyramid of strategic OKRs to find the North Star.
4 - Define the impacts, “business as usual” KPIs (independent of objectives) and other metrics necessary on a daily basis.
However, there is no absolute method. We can absolutely start by building the bottom of the pyramid then go up to the North Star Metric, or on the contrary, start at the top of the pyramid then go back down.
I invite you to take a look at this North Star Metric workshop template which inspired me a lot to organize mine.
Conclusion
A data workshop can be long (very long) and its success is based on a good understanding of the product and our expectations of contributors in order to support them well.
Dashboard design is a subject that is gaining more and more ground in performance management. Beyond UX, the choice of dataviz tools is just as important in the good restitution of this collected data.
I hope you liked this article. Now, it's your turn to play !

Sandra Tsang, UX/UI Product Designer at UX-Republic
