The Chrome DevTools debugger
New Chrome DevTools support for debugging Node.js was launched in the master version of Node.js in May.
You can see it in action in the'Google I/O talk on DevTools but you can also try it for yourself, right away.
Let's go...
Installation: the steps
1. Download and install the current version of node
You can install it manually, or use nvm to install the latest version: nvm install node
2. Run it with the –inspect flag
▸ node –inspect index.js
You can also break the first declaration of the script with –debug-brk.
▸ node –inspect –debug-brk index.js
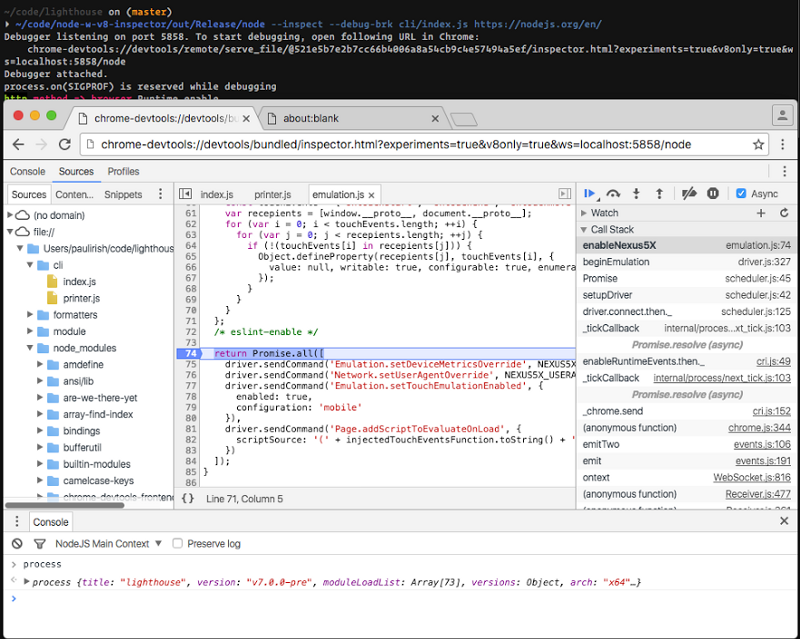
3. Open the provided URL
You will have a URL starting with “chrome-devtools://..” which must be copied/pasted into Chrome.
Then you will have all the features of Chrome DevTools that you are used to using, namely:
- Complete breakpoint debugging, stepping w/ blackboxing
- Source maps for transpiled code
- LiveEdit: JavaScript hot-swap evaluation w/ V8
- Console evaluation with ES6 feature/object support and custom object formatting
- Sampling JavaScript profiler w/ flame chart
- Heap snapshot inspection, heap allocation timeline, allocation profiling
- Asynchronous stacks for native promises
Your turn now !!!
Original article original translated by Isabelle De Carvalho, JS-Humanist & co-founder
[separator type=”” size=”” icon=”star”] [actionbox color=”default” title=”” description=”JS-REPUBLIC is a service company specializing in JavaScript development. We are an approved training center. Find all our technical training on our partner site dedicated to Training” btn_label=”Our training” btn_link=”http://training.ux-republic.com” btn_color=”primary” btn_size=”big” btn_icon=”star” btn_external =”1″]
