How to make data intelligible to ordinary mortals without using pages and pages of workbooks?
Today, illustrating data or information in a fun way is essential to capture the attention of the public. Brands have every interest in understanding this and mastering the mysteries of “data-visualization” if they want to make their content understandable and attractive.
FOR RELEVANT DATA
Data-visualization makes it possible to aggregate tiny snippets of information, scattered on the internet, through an interactive graphical representation that is as ergonomic as possible. These representations are THE face of data. We are talking about a marriage of methods and techniques that make data sexy... Data-visualization has become essential when you have data to format in order to keep the most relevant and to draw an interesting message from it. .
An excellent way to improve the experience of digital content to retain users by being completely transparent and thereby convert new ones!
TO INFINITY AND BEYOND
Here are some examples of particularly successful interactive data visualizations!
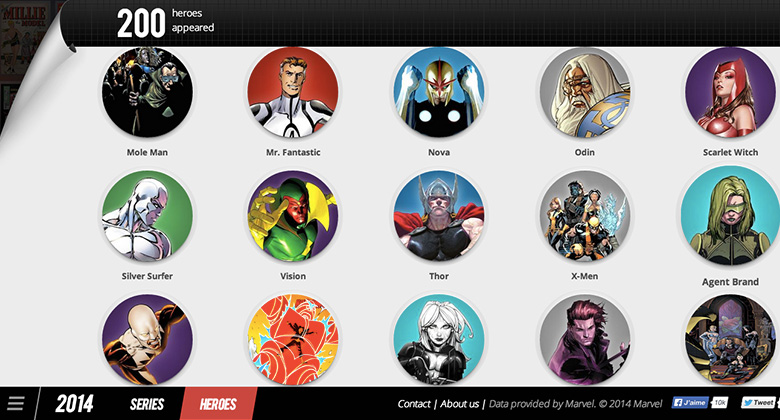
Ultimate 75th – Marvel Superheroes Retrospective
'Ultimate 75th' brings together 75 years of Marvel superhero stories, thousands of data available and accessible to everyone with just a few clicks. Files on all the Marvel characters are available there, and allow you to see in which publications the characters appeared for the first time. The site also provides detailed statistics on the glorious years in terms of new publications. Test this data-visualization here !
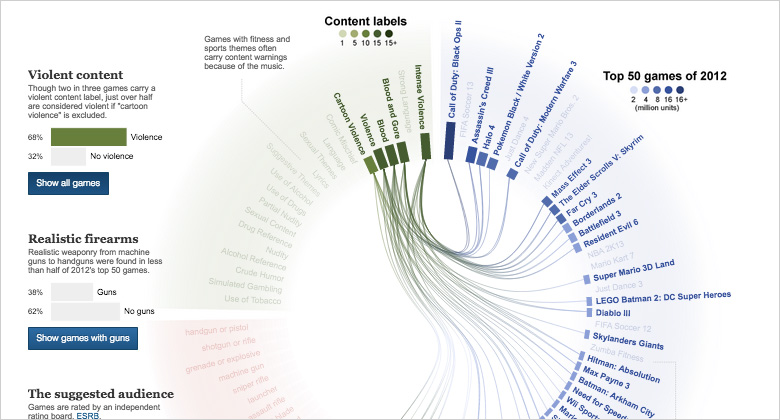
The Guardian
Following the hype for the game in the Grand Theft Auto series, an analysis by 'The Guardian' of the top 50 video games sold in 2012 proved that more than half contain labels of violent content. Overall, a third have weapons that represent real firearms. Test this data-visualization here !
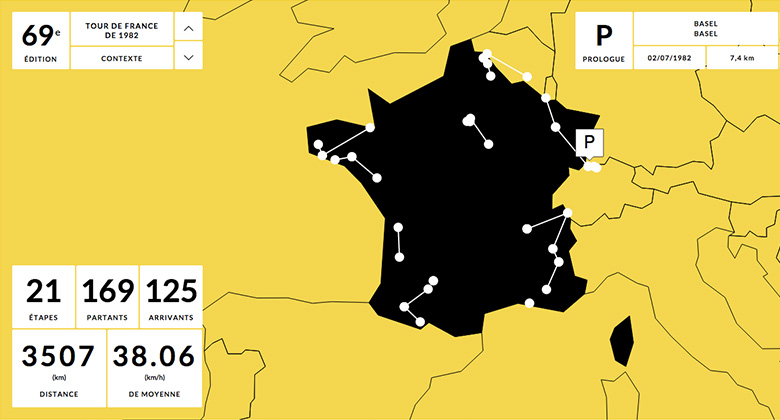
The Tour de France – 100 years of Tour
'100 years of Tour' allows you to relive the history of the Grande Boucle with all the stages, participants and ranked riders. There are also detailed data concerning the ranking of runners by country, as well as information relating to the winner of each stage through a fun and complete data-visualization, enough to become unbeatable... Test this data-visualization here !
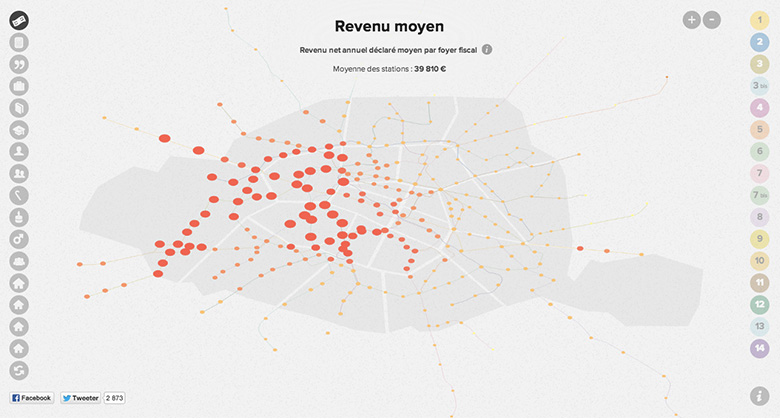
DataParis
A data-visualization that highlights data on Paris and Parisians located through the metropolitan network from a statistical angle through its metro stations. 'DataParis' offers 17 filters, ranging from the proportion of single people to the average income and the unemployment rate. Test this data-visualization here !
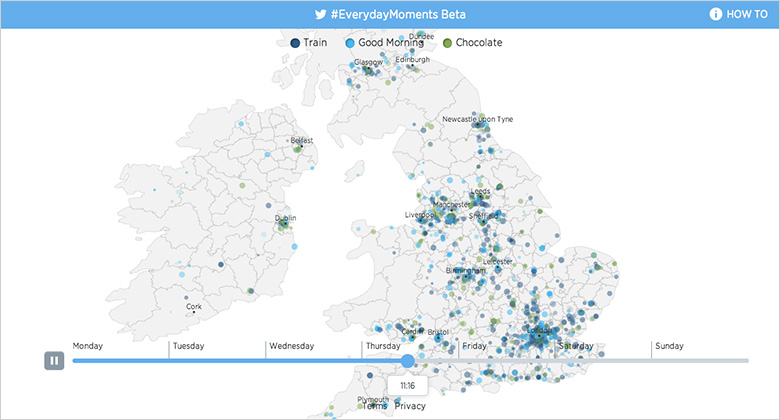
Twitter
Even some of the biggest internet and social media companies are experimenting with different types of data visualization. Currently in beta version, 'Twitter' studies current topics in terms of geographical area. Test this data-visualization here !
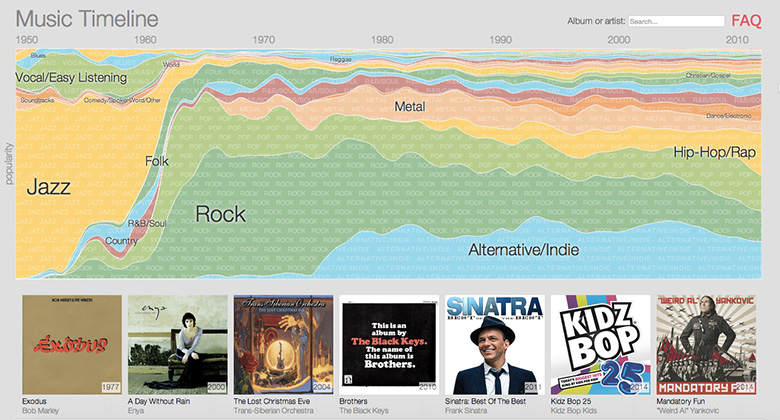
Music Timeline
Google is exploring how visualizing complex data can be accessible, useful, and even fun. 'Music Timeline' is the result of this research and offers a data-visualization allowing to explore the different musical genres by combining the year and a selection of artists referring to it. You can also search by artist and discover all the albums produced during his career. Test this data-visualization here !
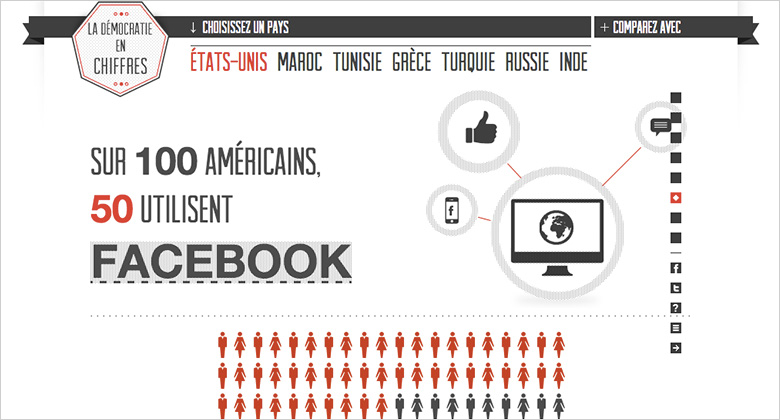
Democracy in numbers
Arte provides an interactive data-visualization to present the democratic situation of 7 countries putting forward their international statistics. 'Democracy in figures' allows you to browse the history of a country in a few figures, even compare them and thus have a quick knowledge of the various key information. Test this data-visualization here !
Thanks to science and IT, data are everywhere and make it possible both to model the climate and to anticipate consumer behavior.
Sectors of use:
• Telecoms, Energy, Marketing, Health, Weather
• Sporting event, politics
• Distribution, Product launch
If you have any questions or other great examples to share, feel free to leave a comment below.
Kaouthar ZOUARI – UX-Activist @UX-Republic


DIGITAL ACCESSIBILITY AWARENESS #Paris
SMILE Paris
163 quay of Doctor Dervaux 92600 Asnières-sur-Seine
DIGITAL ACCESSIBILITY AWARENESS #Belgium
UX-REPUBLIC Belgium
12 avenue de Broqueville - 1150 Woluwe-Saint-Pierre
ACCESSIBLE UX/UI DESIGN # Paris
SMILE Paris
163 quay of Doctor Dervaux 92600 Asnières-sur-Seine
AWARENESS OF DIGITAL ECO-DESIGN # Belgium
UX-REPUBLIC Belgium
12 avenue de Broqueville - 1150 Woluwe-Saint-Pierre

STORYTELLING: THE ART OF CONVINCING # Paris
SMILE Paris
163 quay of Doctor Dervaux 92600 Asnières-sur-Seine


UX/UI ECO-DESIGN # Paris
SMILE Paris
163 quay of Doctor Dervaux 92600 Asnières-sur-Seine

DESIGN THINKING: CREATING INNOVATION # Belgium
UX-REPUBLIC Belgium
12 avenue de Broqueville - 1150 Woluwe-Saint-Pierre


MANAGING AND MEASURING UX # Paris
SMILE Paris
163 quay of Doctor Dervaux 92600 Asnières-sur-Seine

DESIGN SPRINT: INITIATION & FACILITATION # Paris
SMILE Paris
163 quay of Doctor Dervaux 92600 Asnières-sur-Seine
